Physical Address
304 North Cardinal St.
Dorchester Center, MA 02124
Physical Address
304 North Cardinal St.
Dorchester Center, MA 02124

The greatest, the least, and others in between.
The greatest, the least, and others in between.
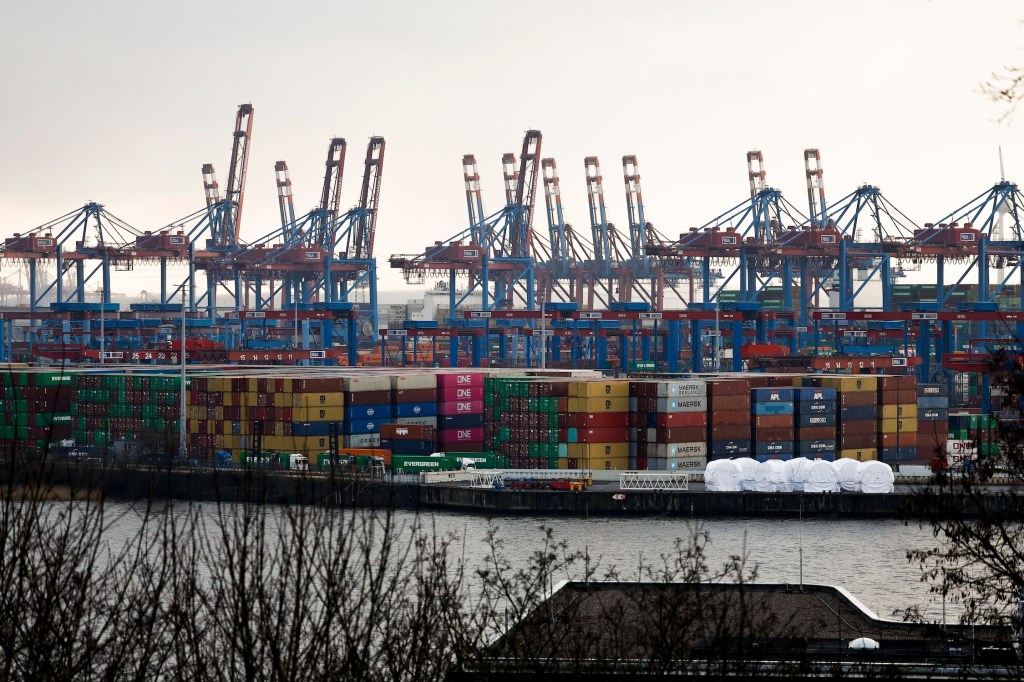
Although spot freight rates continue to tumble as more global ocean freight capacity enters the market, congestion in the largest ports in Asia and Northern Europe still endures.
The Port of Singapore, the world’s largest transshipment hub and second-largest overall, is seeing containers sit in ports for a week at a time. The average dwelling period of a container transferred from one vessel to another is 7.1 days, according to data from EconDB.
These container dwell times are even worse at Rotterdam, with boxes waiting 9.1 days to be moved from one ship to another. In Antwerp, containers are sitting around for 6.7 days waiting to be loaded.
Both ports, based out of the Netherlands and Belgium respectively, have endured multiple union dockworker strikes over several days in February that have slowed operations.
In the case of Antwerp, the port’s DP World Terminal has faced operational challenges affecting all handling areas, according to a notice from Kuehne + Nagel last Thursday. Due to severe yard congestion, the terminal is implementing emergency measures.
“With stacking capacity fully utilized, the port will reduce export delivery truck slots to 30 percent to prioritize the swift removal of import containers,” the notice said. “Additionally, berth priorities are being adjusted to expedite the clearance of export and transshipment containers. The terminal will reject any additional import or transshipment cargo from nearby ports.”
For Rotterdam, many of the problems are confined to Hutchison Ports’ Delta II terminal, where the strikes from unions including FMV Havens and CMV have taken place.
Kuehne + Nagel said the terminal is operating at 50 percent of its usual capacity, and port disruptions are expected to continue until an agreement is reached between the labor groups and Hutchison. The disruption has led to vessel wait times of up to seven days, barge congestion of 76 hours and feeder vessel delays of 72 hours.
In total, 9.1 percent of the total global container fleet is either docked or awaiting to berth at a port, or 2.87 million 20-foot equivalent units (TEUs), Linerlytica said. This has eased off of pre-Lunar New Year levels, when 10.5 percent of global vessel capacity was waiting at port anchorages in late January.
Singapore expects 233 vessels to arrive at its port over the next seven days, well ahead of the 166 ships expected to dock at Ningbo in China in the same period. South Korea’s largest port, Busan, is expecting 150 arrivals, while 134 are heading to the Port of Shanghai.
Rotterdam and Antwerp are expecting 96 and 79 vessels through March 11.
According to a Linerlytica report, the Chinese ports are seeing a sharp rise in vessel arrivals that has coincided with poor weather and fog-related closures. This has led to longer berthing delays in Shanghai, Ningbo and Qingdao.
Across Shanghai and Ningbo, 687,018 TEUs on 154 ships are waiting at anchorage, while Qingdao is anticipating 310,763 TEUs coming over through 56 vessels. All three ports have the highest “queue-to-berth” ratios among ports reeling in 100,000 TEUs, with Qingdao coming in at a 2.64 ratio, and Shanghai/Ningbo having a 2.14 ratio.
The constant port congestion could be what’s keeping charter freight rates up while traditional spot and contract rates take their annual dive.
With that in mind, Linerlytica called a charter market correction “imminent.”
“The widening disconnect between faltering container freight rates and the continued strengthening of container ship charter rates is unsustainable, with the ratio of the charter rate index to the China Containerized Freight Index currently at a historic high,” said Linerlytica in a blog post.
Both spot freight rates and charter rates usually move in tandem, but they can diverge depending on market demand, which has escalated heavily for chartered container ships since October 2021.
According to the Harpex, (Harper Petersen Charter Rates Index) charter rates increased roughly 7 percent from Oct. 1 to Feb. 28, with the majority of the jump coming after the 2024 presidential election. After that point, commercial charter rates have increased 4.5 percent. The greater spike comes presumably as more major retailers that charter their own ships sought to front-load more goods into the U.S. ahead of President Donald Trump’s inauguration.
Unlike spot freight rates, which has largely been in freefall since the beginning of 2025, the Harpex has inched up nearly 1 percent over the two-month span.
The Red Sea diversions have driven the widening divergence in the two indices since the beginning of 2024, according to Linerlytica. However, the company said this could soon be reversed as carriers start to curb their appetite for additional ships amid a weakening freight market.